Loading weather data…
We are fetching the daily values for every year. The first time, this takes a few seconds.
Loading weather data…
We are fetching the daily values for every year. The first time, this takes a few seconds.
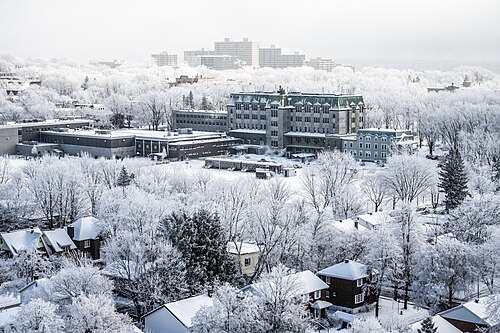
This is what the weather in Quebec City (Quebec, Canada) was like in March over the years 2017–2026.
Avg. daytime high
-1.9 °C
-5.4 °C – 1.9 °C
Avg. night-time low
-11.0 °C
-14.9 °C – -5.9 °C
Avg. rain days in period
12.6
41 % of days · ≥ 1.0 mm
Avg. precipitation in period
82.0 mm
42.6 mm – 129 mm
Avg. cloud cover
70 %
This data source has no sunshine hours – average cloud cover is shown instead.
Avg. sea temperature
–
No sea nearby – no sea temperature.
Extremes: Highest temperature 13.5 °C (25 Mar 2021) · Lowest temperature -29.2 °C (2 Mar 2026) · Avg. daily peak wind 19 km/h
Weather mix of all days
Overall values from all 10 years. How is this calculated?
Average over your travel period
Avg. daytime high: 2017 -5°, 2018 -2°, 2019 -4°, 2020 -2°, 2021 -1°, 2022 -3°, 2023 -1°, 2024 2°, 2025 0°, 2026 -2°. Avg. night-time low: 2017 -15°, 2018 -9°, 2019 -14°, 2020 -12°, 2021 -11°, 2022 -12°, 2023 -10°, 2024 -6°, 2025 -9°, 2026 -12°.
Precipitation (mm): 2017 84, 2018 43, 2019 80, 2020 129, 2021 79, 2022 101, 2023 51, 2024 61, 2025 81, 2026 111.
2026
Max 4.1 °C · Min -29.2 °C
2025
Max 12.0 °C · Min -25.0 °C
2024
Max 7.1 °C · Min -18.0 °C
2023
Max 2.1 °C · Min -20.0 °C
2022
Max 1.2 °C · Min -28.2 °C
2021
Max 13.5 °C · Min -23.3 °C
2020
Max 1.7 °C · Min -22.8 °C
2019
Max 1.9 °C · Min -25.8 °C
2018
Max 3.4 °C · Min -23.3 °C
2017
Max 0.7 °C · Min -28.1 °C
Choose your travel period – we show the weather for exactly those days.