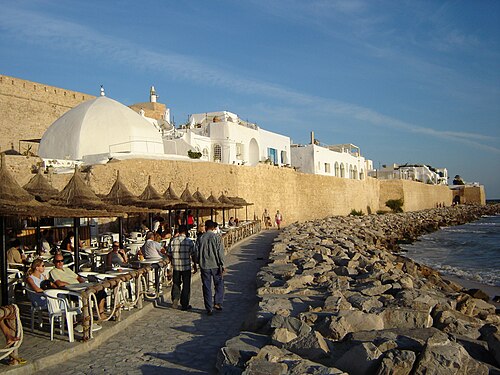
🇹🇳 Weather in Hammamet in September
This is what the weather in Hammamet (Tunisia) was like in September in 2017–2026.
Key facts at a glance
Avg. daytime high
30.6 °C
28.7 °C – 32.8 °C
Avg. night-time low
22.6 °C
20.9 °C – 24.0 °C
Avg. rain days in period
8.0
27 % of days · ≥ 1.0 mm
Avg. precipitation in period
61.9 mm
1.2 mm – 146 mm
Avg. sunshine per day
n/a
Sunshine duration is not available from this data source.
Avg. sea temperature
27.0 °C
Sea point approx. 3 km from the location
Extremes: Highest temperature 38.6 °C (2 Sep 2026) · Lowest temperature 16.6 °C (28 Sep 2020) · Avg. daily peak wind 22 km/h
Weather mix of all days
- 129Sunny
- 63Partly cloudy
- 7Cloudy
- 51Light rain
- 29Rain
Summary
- On average 30.6 °C during the day and 22.6 °C at night.
- On average 8.0 rain days (Rain day = at least 1.0 mm of precipitation) with 61.9 mm of precipitation in total.
- In 1 of 10 years there was not a single rain day.
- The sea averaged 27.0 °C.
- Prevailing: Sunny.
- Warmest year: 2022 (avg. 32.8 °C), coolest: 2020 (avg. 28.7 °C).
- Wettest year: 2024 (146 mm), driest: 2023 (1.2 mm).
- Extremes: 38.6 °C on 2 Sep 2026 and 16.6 °C on 28 Sep 2020.
Overall values from all 10 years. How is this calculated?
Charts
Temperatures per year
Average over your travel period
Precipitation & rain days
Year by year
2026
Avg. max32.1°Avg. min24.0°- Rain days
- 9 Rain days
- Precipitation
- 62.6 mm
- Avg. sunshine per day
- n/a
- Sea temperature
- 28.8 °C
Max 38.6 °C · Min 21.2 °C
2025
Avg. max31.3°Avg. min22.7°- Rain days
- 7 Rain days
- Precipitation
- 48.8 mm
- Avg. cloud cover
- 31 % cloudy
- Sea temperature
- 27.1 °C
Max 37.2 °C · Min 19.1 °C
2024
Avg. max30.1°Avg. min22.1°- Rain days
- 9 Rain days
- Precipitation
- 146 mm
- Avg. cloud cover
- 36 % cloudy
- Sea temperature
- 26.5 °C
Max 35.9 °C · Min 17.4 °C
2023
Avg. max31.3°Avg. min22.7°- Rain days
- 0 Rain days
- Precipitation
- 1.2 mm
- Avg. cloud cover
- 22 % cloudy
- Sea temperature
- 26.6 °C
Max 37.1 °C · Min 19.1 °C
2022
Avg. max32.8°Avg. min23.8°- Rain days
- 7 Rain days
- Precipitation
- 23.2 mm
- Avg. cloud cover
- 32 % cloudy
- Sea temperature
- 27.8 °C
Max 37.6 °C · Min 19.2 °C
2021
Avg. max31.1°Avg. min23.5°- Rain days
- 5 Rain days
- Precipitation
- 19.5 mm
- Avg. cloud cover
- 35 % cloudy
- Sea temperature
- 27.4 °C
Max 35.6 °C · Min 19.6 °C
2020
Avg. max28.7°Avg. min21.5°- Rain days
- 17 Rain days
- Precipitation
- 140 mm
- Avg. cloud cover
- 41 % cloudy
- Sea temperature
- 26.5 °C
Max 32.3 °C · Min 16.6 °C
2019
Avg. max29.4°Avg. min21.9°- Rain days
- 13 Rain days
- Precipitation
- 98.3 mm
- Avg. cloud cover
- 33 % cloudy
- Sea temperature
- 26.6 °C
Max 32.9 °C · Min 20.0 °C
2018
Avg. max30.0°Avg. min22.6°- Rain days
- 9 Rain days
- Precipitation
- 71.8 mm
- Avg. cloud cover
- 39 % cloudy
- Sea temperature
- 27.0 °C
Max 35.9 °C · Min 18.1 °C
2017
Avg. max29.5°Avg. min20.9°- Rain days
- 4 Rain days
- Precipitation
- 8.6 mm
- Avg. cloud cover
- 28 % cloudy
- Sea temperature
- 25.9 °C
Max 34.7 °C · Min 17.5 °C
Frequently asked questions
- How warm is it in Hammamet in September?
- Daytime highs averaged 30.6 °C, night-time lows 22.6 °C. The highest value of the past 10 years was 38.6 °C (2 Sep 2026), the lowest 16.6 °C (28 Sep 2020).
- How often does it rain in Hammamet in September?
- On average there were 8.0 rain days (at least 1 mm) with 61.9 mm of precipitation in total. In 1 of 10 years there was no rain day at all.
- How warm is the sea in Hammamet in September?
- The sea temperature averaged 27.0 °C (open-sea point approx. 3 km from the town).
Check your exact travel dates
Choose your travel period – we show the weather for exactly those days.
Other destinations in September
Data sources
- Weather data
- Data obtained from the NASA Langley Research Center (LaRC) POWER Project funded through the NASA Earth Science/Applied Science Program
Reanalysis (weather model constrained by observations) on a coarse grid of about 50 km. Values represent a large area and can differ from local conditions, especially on islands, coasts and in mountains. No sunshine duration.
Reanalysis (weather model constrained by observations)
Reanalysis values represent a grid cell (approx. 25–50 km) and may differ from local measurements on coasts, islands and in mountains. - Sea temperature
- MUR SST data were provided by JPL under support by NASA MEaSUREs program; accessed via NOAA CoastWatch ERDDAP
Daily multi-scale ultra-high resolution (≈ 1 km) analysis of satellite measurements (infrared, microwave) and in-situ data. Represents the foundation temperature below the daily warm surface layer. (Satellite and in-situ analysis) - Sea point approx. 3 km from the location (36.380, 10.610)
- Place search
- Natural Earth (public domain) · GeoNames (CC BY 4.0) / OpenStreetMap (ODbL)