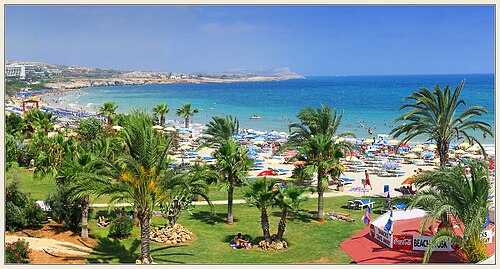
🇨🇾 Weather in Ayia Napa in June
This is what the weather in Ayia Napa (Cyprus) was like in June in 2017–2026.
Key facts at a glance
Avg. daytime high
30.4 °C
29.0 °C – 33.7 °C
Avg. night-time low
23.7 °C
22.3 °C – 26.3 °C
Avg. rain days in period
0.4
1 % of days · ≥ 1.0 mm
Avg. precipitation in period
3.3 mm
0.4 mm – 8.9 mm
Avg. cloud cover
24 %
This data source has no sunshine hours – average cloud cover shown instead.
Avg. sea temperature
24.7 °C
Sea point approx. 3 km from the location
Extremes: Highest temperature 38.7 °C (14 Jun 2024) · Lowest temperature 18.7 °C (1 Jun 2020) · Avg. daily peak wind 17 km/h
Weather mix of all days
- 206Sunny
- 85Partly cloudy
- 5Cloudy
- 3Light rain
- 1Rain
Summary
- On average 30.4 °C during the day and 23.7 °C at night.
- On average 0.4 rain days (Rain day = at least 1.0 mm of precipitation) with 3.3 mm of precipitation in total.
- In 7 of 10 years there was not a single rain day.
- The sea averaged 24.7 °C.
- Prevailing: Sunny.
- Warmest year: 2024 (avg. 33.7 °C), coolest: 2023 (avg. 29.0 °C).
- Wettest year: 2022 (8.9 mm), driest: 2025 (0.4 mm).
- Extremes: 38.7 °C on 14 Jun 2024 and 18.7 °C on 1 Jun 2020.
Overall values from all 10 years. How is this calculated?
Charts
Temperatures per year
Average over your travel period
Precipitation & rain days
Year by year
2026
Avg. max29.8°Avg. min23.3°- Rain days
- 0 Rain days
- Precipitation
- 1.7 mm
- Avg. cloud cover
- 19 % cloudy
- Sea temperature
- 24.5 °C
Max 34.4 °C · Min 19.9 °C
2025
Avg. max31.3°Avg. min24.5°- Rain days
- 0 Rain days
- Precipitation
- 0.4 mm
- Avg. cloud cover
- 25 % cloudy
- Sea temperature
- 25.0 °C
Max 34.3 °C · Min 20.3 °C
2024
Avg. max33.7°Avg. min26.3°- Rain days
- 0 Rain days
- Precipitation
- 1.6 mm
- Avg. cloud cover
- 28 % cloudy
- Sea temperature
- 26.5 °C
Max 38.7 °C · Min 20.5 °C
2023
Avg. max29.0°Avg. min22.7°- Rain days
- 0 Rain days
- Precipitation
- 3.0 mm
- Avg. cloud cover
- 34 % cloudy
- Sea temperature
- 23.9 °C
Max 33.4 °C · Min 19.5 °C
2022
Avg. max29.7°Avg. min23.4°- Rain days
- 1 Rain days
- Precipitation
- 8.9 mm
- Avg. cloud cover
- 19 % cloudy
- Sea temperature
- 24.2 °C
Max 33.4 °C · Min 21.6 °C
2021
Avg. max29.5°Avg. min22.8°- Rain days
- 2 Rain days
- Precipitation
- 5.1 mm
- Avg. cloud cover
- 19 % cloudy
- Sea temperature
- 24.1 °C
Max 35.9 °C · Min 20.4 °C
2020
Avg. max29.4°Avg. min22.3°- Rain days
- 0 Rain days
- Precipitation
- 0.9 mm
- Avg. cloud cover
- 29 % cloudy
- Sea temperature
- 23.6 °C
Max 33.6 °C · Min 18.7 °C
2019
Avg. max30.5°Avg. min24.3°- Rain days
- 1 Rain days
- Precipitation
- 4.9 mm
- Avg. cloud cover
- 29 % cloudy
- Sea temperature
- 25.1 °C
Max 34.5 °C · Min 21.0 °C
2018
Avg. max30.2°Avg. min24.2°- Rain days
- 0 Rain days
- Precipitation
- 4.9 mm
- Avg. cloud cover
- 28 % cloudy
- Sea temperature
- 25.3 °C
Max 35.2 °C · Min 22.7 °C
2017
Avg. max30.5°Avg. min23.7°- Rain days
- 0 Rain days
- Precipitation
- 1.5 mm
- Avg. cloud cover
- 14 % cloudy
- Sea temperature
- 24.5 °C
Max 36.7 °C · Min 20.4 °C
Frequently asked questions
- How warm is it in Ayia Napa in June?
- Daytime highs averaged 30.4 °C, night-time lows 23.7 °C. The highest value of the past 10 years was 38.7 °C (14 Jun 2024), the lowest 18.7 °C (1 Jun 2020).
- How often does it rain in Ayia Napa in June?
- On average there were 0.4 rain days (at least 1 mm) with 3.3 mm of precipitation in total. In 7 of 10 years there was no rain day at all.
- How warm is the sea in Ayia Napa in June?
- The sea temperature averaged 24.7 °C (open-sea point approx. 3 km from the town).
Check your exact travel dates
Choose your travel period – we show the weather for exactly those days.
Other destinations in June
Data sources
- Weather data
- Data obtained from the NASA Langley Research Center (LaRC) POWER Project funded through the NASA Earth Science/Applied Science Program
Reanalysis (weather model constrained by observations) on a coarse grid of about 50 km. Values represent a large area and can differ from local conditions, especially on islands, coasts and in mountains. Snow depth is the model value for the grid cell, not the depth on the slopes. No sunshine duration.
Reanalysis (weather model constrained by observations)
Reanalysis values represent a grid cell (approx. 25–50 km) and may differ from local measurements on coasts, islands and in mountains. - Sea temperature
- MUR SST data were provided by JPL under support by NASA MEaSUREs program; accessed via NOAA CoastWatch ERDDAP
Daily multi-scale ultra-high resolution (≈ 1 km) analysis of satellite measurements (infrared, microwave) and in-situ data. Represents the foundation temperature below the daily warm surface layer. (Satellite and in-situ analysis) - Sea point approx. 3 km from the location (34.960, 33.990)
- Place search
- Natural Earth (public domain) · GeoNames (CC BY 4.0) / OpenStreetMap (ODbL)